Most small businesses do not need a complicated AI search dashboard.
They need a simple one they can actually keep up with every week.
The mistake is trying to measure everything at once:
- Every model.
- Every keyword.
- Every traffic source.
- Every ranking change.
That creates noise fast.
A better question is:
“What can AI systems actually see, repeat, and confirm about my business this week?”
That leads to a much simpler dashboard.
For most SMBs, three metrics are enough:
- Coverage.
- Citations.
- Confirmations.
These are not vanity numbers.
They are the inputs that tell you whether your business is becoming easier for AI systems to understand and trust.
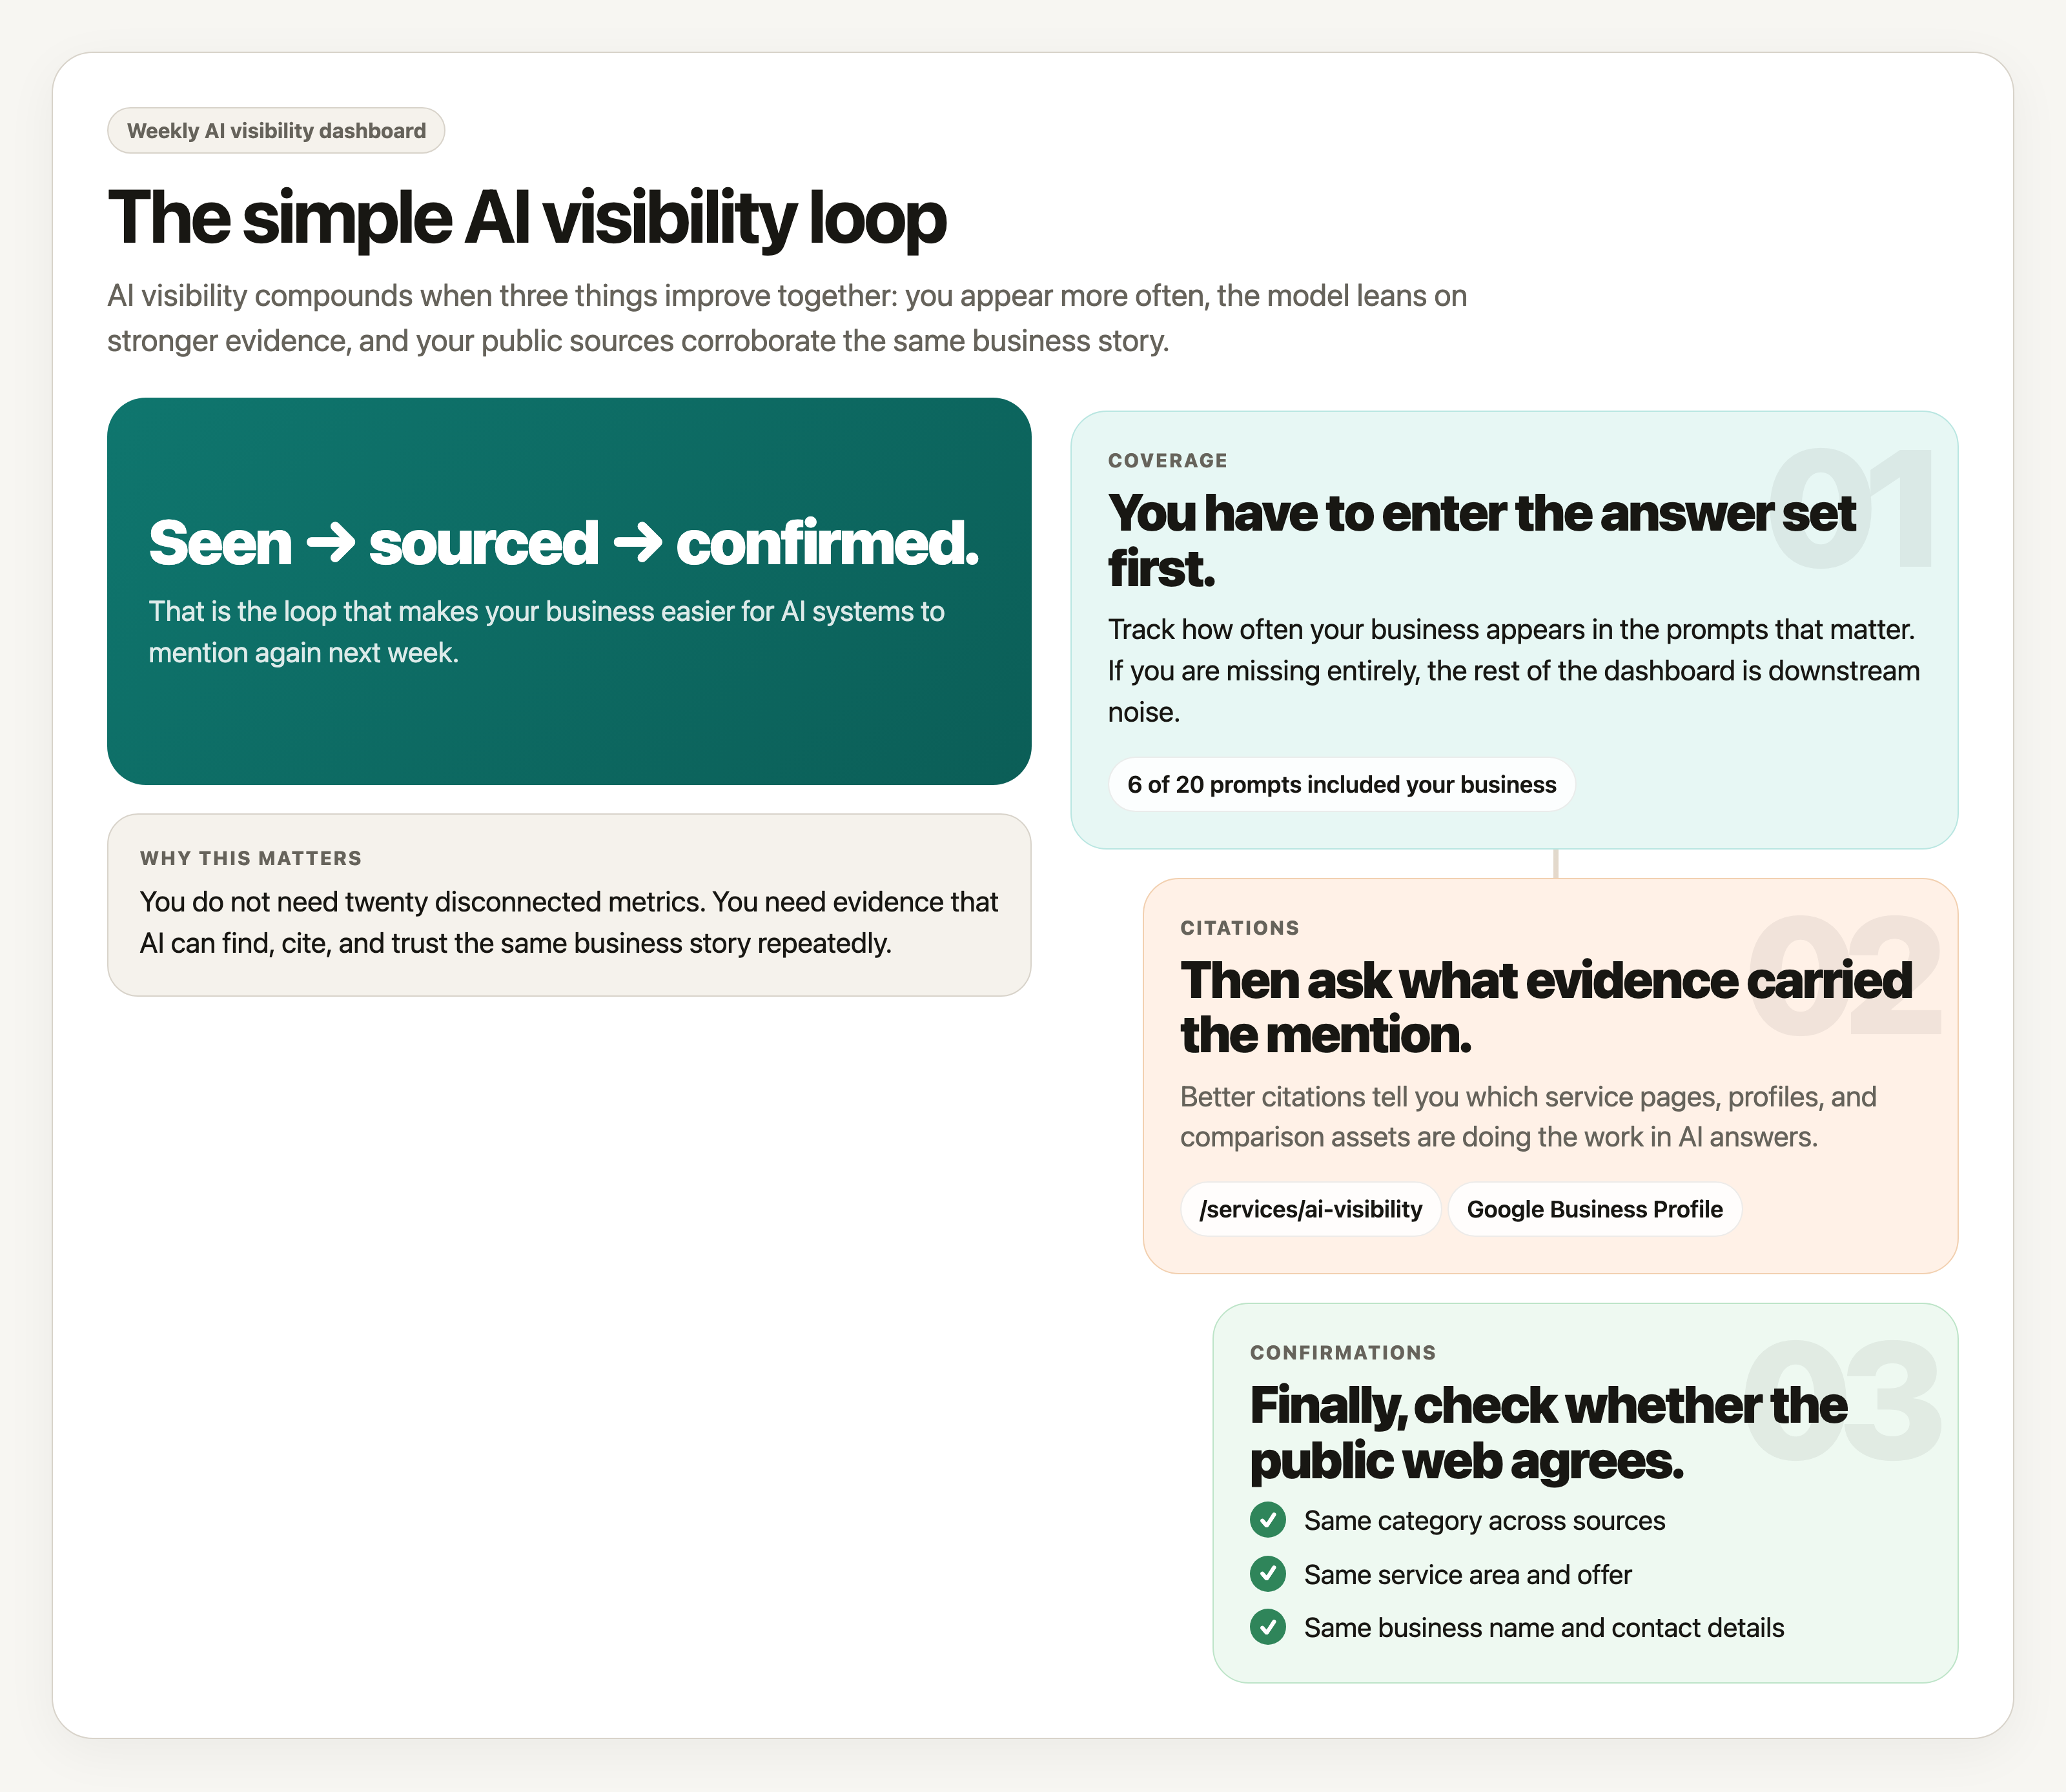
The three metrics that matter
Coverage
Coverage answers one question:
How often do you show up at all?
If you run a fixed set of prompts each week, coverage is the number of times your business gets mentioned, recommended, or included in the answer.
Examples:
- “Best accountants for small businesses in Denver.”
- “Who helps law firms with AI search visibility.”
- “Recommended HVAC companies in Columbus.”
If your business appears in 6 out of 20 tracked prompts this week, your coverage is 30%.
Coverage tells you whether you are entering the candidate set at all.
If coverage is zero, the rest of the dashboard matters less. You are not consistently showing up.
Citations
Citations answer a different question:
When you do show up, what evidence is the model using?
This includes:
- Links to your website.
- References to your service pages.
- Mentions of reviews, directories, or articles about you.
- Repeated facts that clearly came from public sources.
Citations matter because they show what the model is leaning on.
If a model keeps mentioning your business but never points to a useful page, that is weaker than being cited through a strong service page, comparison page, review profile, or article.
Good citation tracking helps you see which assets are actually doing work.
Confirmations
Confirmations are the easiest metric to ignore and the most important one to watch.
Confirmation means the model can verify your core facts across multiple places.
Examples of confirmable facts:
- Your business category.
- Your location or service area.
- Your core services.
- Your company name.
- Your contact details.
If your website, Google Business Profile, LinkedIn page, directory listings, and review sites all reinforce the same story, confirmations go up.
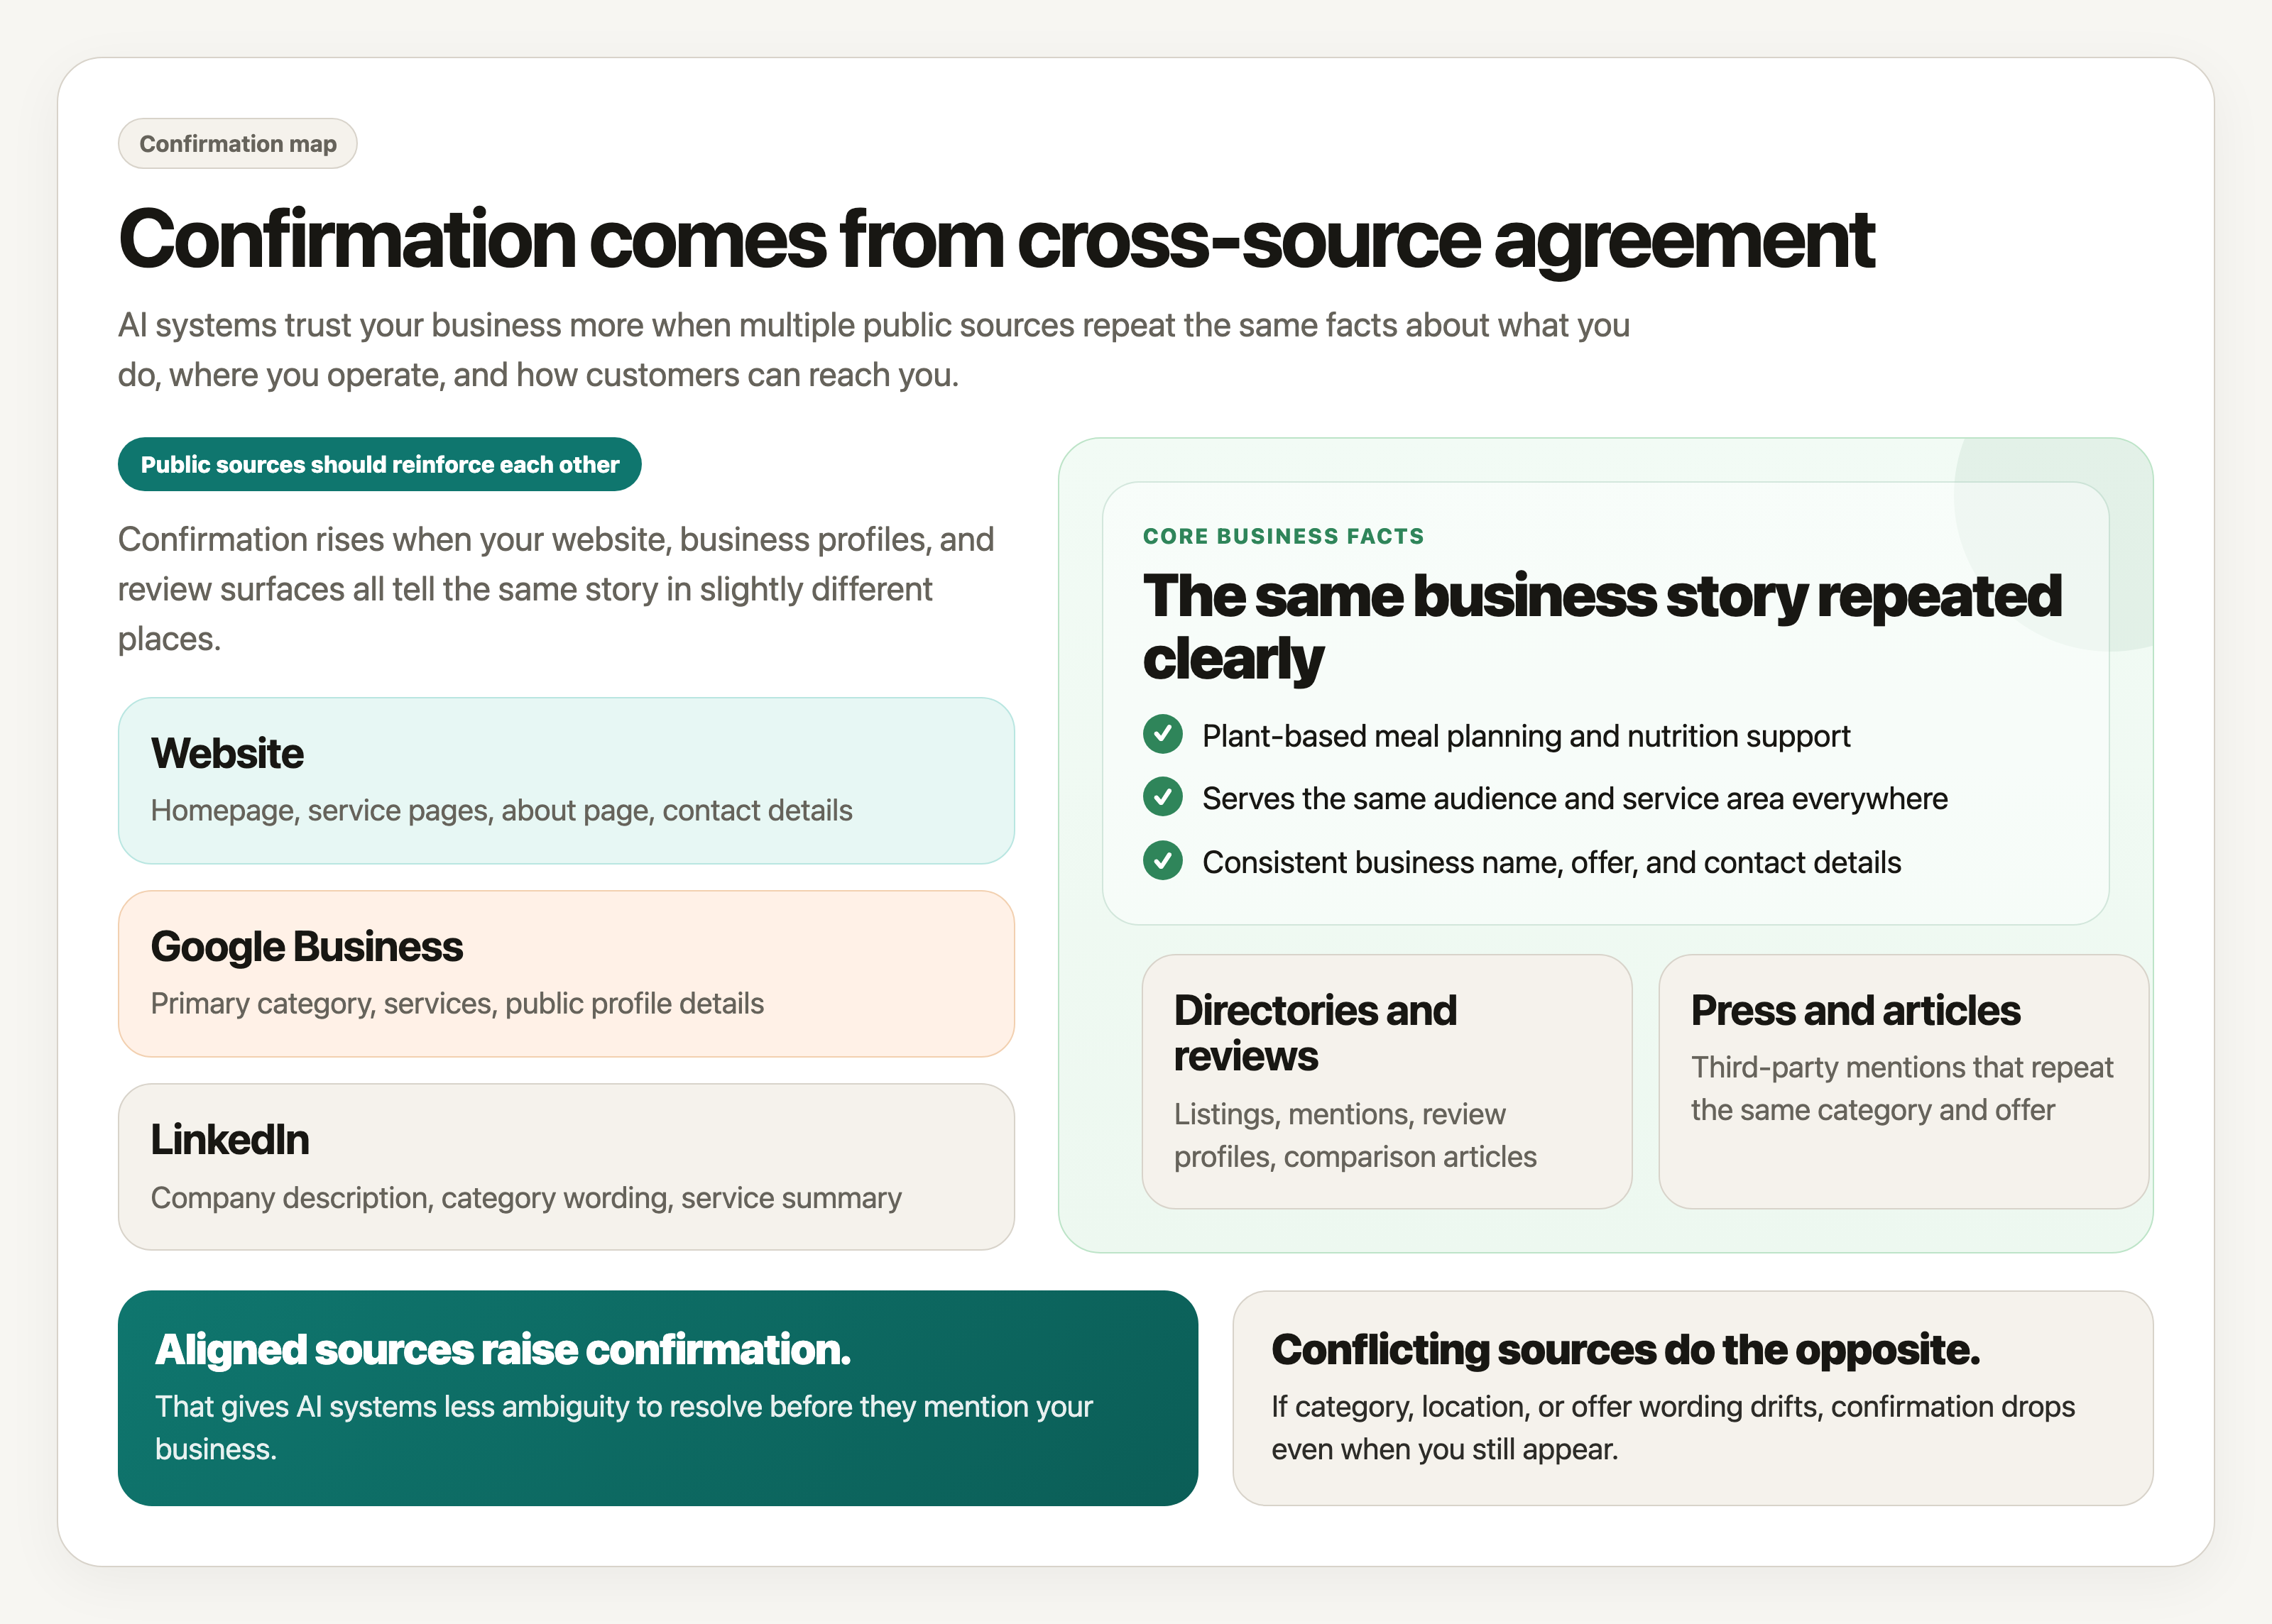
If they conflict, confirmations go down.
This metric matters because AI systems trust corroborated facts more than isolated claims.
Coverage gets you seen.
Citations show what is carrying you.
Confirmations increase the odds that your business will be trusted enough to mention again.
A simple dashboard example
Here is what a weekly dashboard can look like:
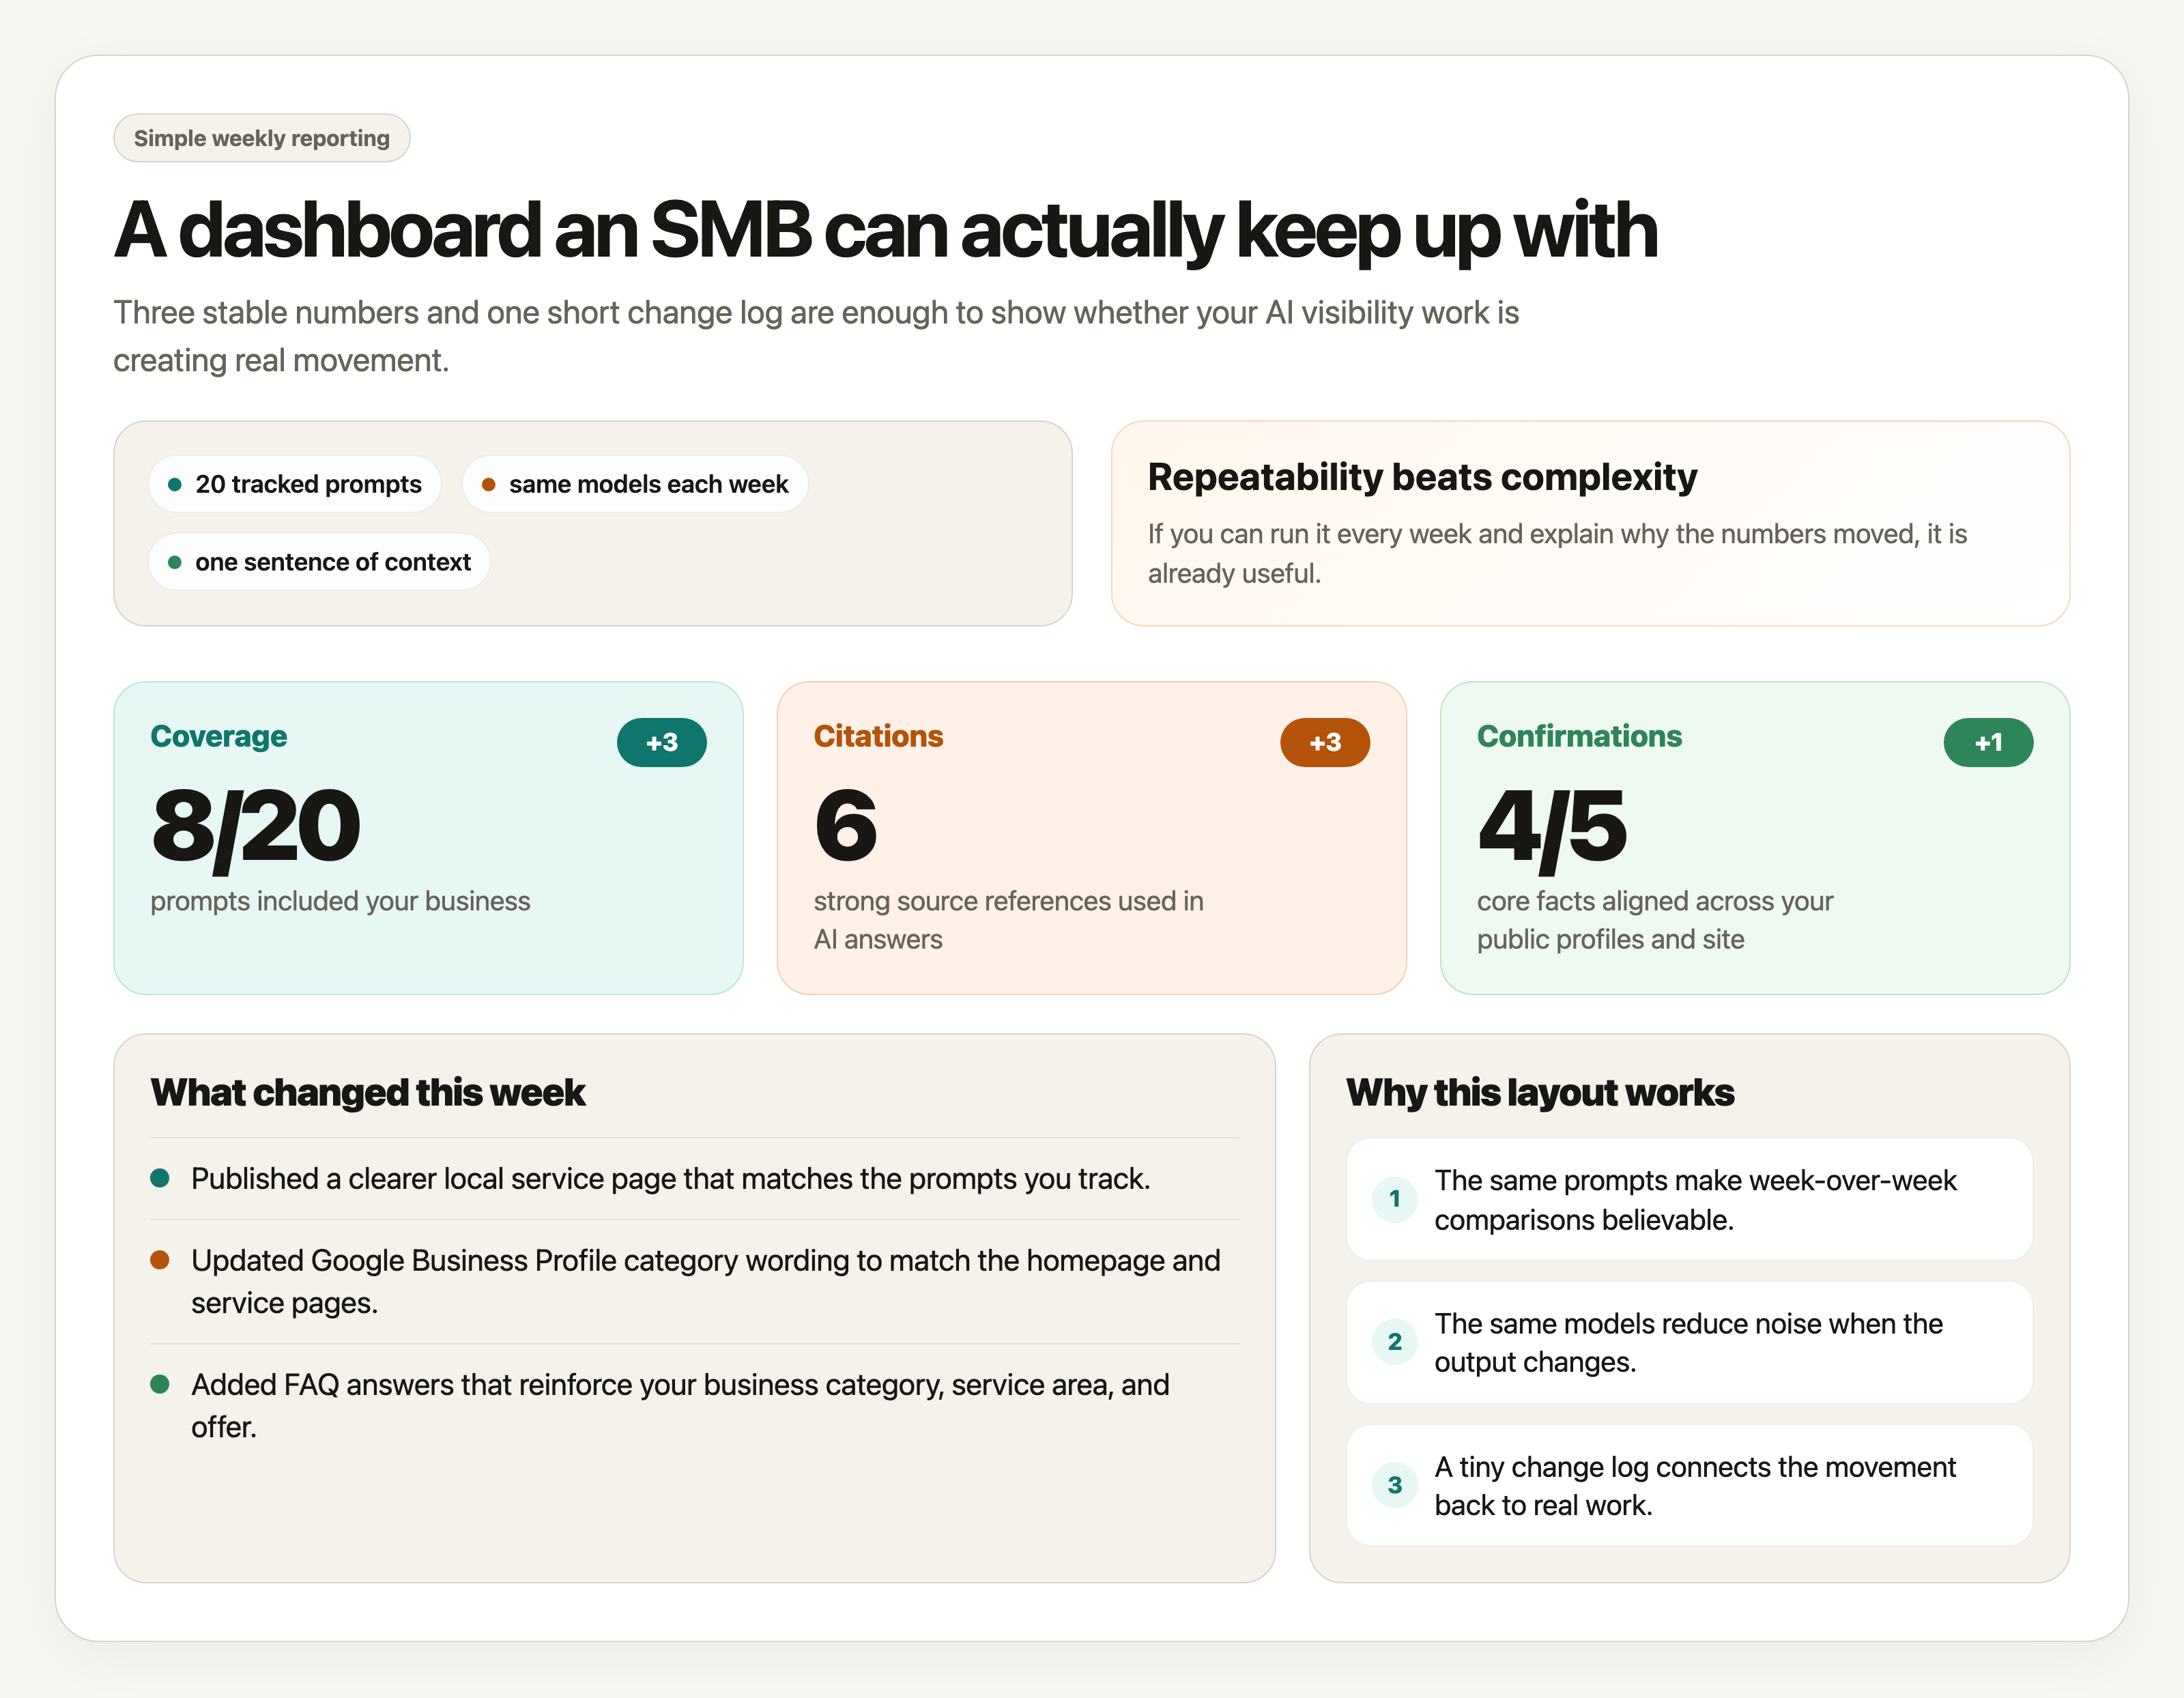
| Metric | This Week | Last Week | Change | What it means |
|---|---|---|---|---|
| Coverage | 8 of 20 prompts | 5 of 20 prompts | +3 | Your business appeared in more tracked AI answers. |
| Citations | 6 strong source references | 3 strong source references | +3 | Models relied on more specific pages and public references. |
| Confirmations | 4 of 5 core facts aligned | 3 of 5 core facts aligned | +1 | Your business details matched across more public sources. |
You can add a short notes column in your own sheet if you want to record why something moved.
For example:
- Added a clearer service page.
- Fixed inconsistent category wording.
- Earned a new directory listing.
- Published a comparison page.
- Updated your Google Business Profile.
That makes the dashboard much more useful than just looking at numbers alone.
Where the data should come from
Do not overcomplicate this.
Use the same sources every week so the comparison stays fair.
For most businesses, the dashboard should pull from four places:
1. A fixed prompt set
Choose a small list of prompts you care about and keep them stable.
That might include:
- Branded prompts.
- Category prompts.
- Local prompts.
- Competitor comparison prompts.
- Problem-based prompts.
If you change the prompts every week, the dashboard becomes much less meaningful.
Consistency matters more than volume.
2. Model outputs
Track the same AI systems each week if possible.
You do not need every model on earth.
Start with the few that matter most to your customers.
Log:
- Whether you appeared.
- Where you appeared.
- Which page or fact seemed to drive the mention.
3. Your public web presence
This is where confirmation work happens.
Check the sources that define your business most clearly:
- Homepage.
- Service pages.
- About page.
- Contact page.
- Google Business Profile.
- LinkedIn.
- Major directories or review profiles.
You are looking for alignment, not volume.
4. Your change log
Keep a tiny weekly record of what you changed.
Examples:
- Rewrote homepage description.
- Added FAQ schema.
- Published a new service page.
- Corrected service-area wording.
- Created an
llms.txtfile.
Without a change log, it becomes much harder to explain why the numbers moved.
How to run it every week
The weekly process should take less than 30 minutes once it is set up.
- Run the same prompt set against the same models.
- Mark whether your business appeared in each result.
- Record the strongest citation or supporting source used in each answer.
- Check your core facts across your site and public profiles.
- Update the three dashboard numbers.
- Add one sentence explaining what changed this week.
That is enough.
The goal is not to create a perfect reporting system.
The goal is to notice movement early and tie that movement back to real work.
How to validate changes instead of guessing
This is where the dashboard becomes valuable.
When a metric moves, do not just celebrate it. Validate it.
Ask:
- Did coverage improve because we changed the website, or because the prompt happened to be easier?
- Did citations improve because a better page got indexed, or because the model phrased the answer differently?
- Did confirmations improve because we fixed contradictions, or because we only checked one source?
The safest way to validate change is to keep the inputs steady:
- Same prompts.
- Same models.
- Same source list.
- Same definitions.
- Same weekly rhythm.
Then compare the output against your actual changes.
If you updated a service page on Tuesday and citations to that page start showing up on the next run, that is useful evidence.
If you cleaned up your business category across your homepage, directory listings, and LinkedIn, and confirmations improve the following week, that is a believable signal.
This is also why screenshots and saved outputs help.
Do not rely on memory alone. Keep artifacts.
A weekly checklist
Before you call the dashboard done, check these:
- Did I use the same prompts as last week?
- Did I check the same models and record the results cleanly?
- Did I identify the strongest citation or source behind each mention?
- Did I confirm our core facts across the main public profiles?
- Did I write down what changed on the website or elsewhere this week?
- Can I explain why the numbers moved without hand-waving?
If yes, you have a dashboard that is good enough to guide real work.
The bigger point
A lot of reporting makes small businesses feel informed without making them clearer.
That is the trap.
You do not need a dashboard that makes AI search look sophisticated.
You need one that tells you:
- Are we getting seen?
- What is helping us get cited?
- Are our facts consistent enough to trust?
If you can answer those three questions every week, you are already measuring what AI can actually see.